Sampling Distribution of the Sample Mean
STAT 205: Introduction to Mathematical Statistics
Histogram: Population vs Sample


For the population we might be interested in some parameter, for example, the average loan amount, i.e. the mean value \(\mu\), and its standard deviation \(\sigma\).


For the first sample, \(\bar x_1\) = 15564

For the second sample, \(\bar x_2\) = 14651.5

For the third sample, \(\bar x_3\) = 16365.5

For the forth sample, \(\bar x_4\) = 17454.5

For the fifth sample, \(\bar x_5\) = 15201

For the sixth sample, \(\bar x_6\) = 16241
In simulation land, I can take as many random samples as I like.
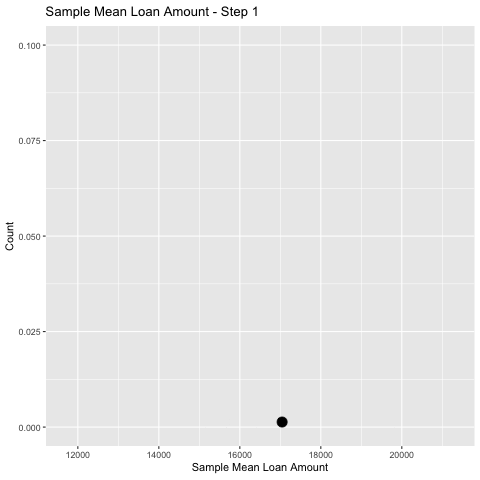
👈 Here I take 500 samples of size \(n=50\) and keep track of the sample mean, \(\bar x\), for each.
⏩ The collection of \(\bar x\)’s forms an rough estimate of the probability distribution of \(\bar X\).
In simulation land, I can take as many random samples as I like.
👈 Here I take 500 samples of size \(n=50\) and keep track of the sample mean, \(\bar x\), for each.
⏩ The collection of \(\bar x\)’s forms an empirical approximation of the sampling distribution of the sample mean \(\bar X\).
Empirical Sampling Distribution

To get an empirical estimate of the distribution, we plot a histogram of sample means we have observed.
Theoretical Sampling Distribution

Thanks to the Central Limit Theorem we actually know what the theoretical probability distribution of \(\overline{X}\) is …
Theoretical Sampling Distribution

Thanks to the Central Limit Theorem we actually know what the theoretical probability distribution of \(\overline{X}\) is …
CTL Visualized

Empirical Rule


Use this table to find probabilities for
positive Z-scores!
Use this table to find
probabilities for
negative Z-scores!


pnorm for Standard Normal
For the standard normal we use the defaults


General pnorm
For some \(X \sim N(\mu = \texttt{mu}, \sigma = \texttt{sig})\)…


Visualize Probabilities


Household Groceries (iClicker)
Exercise 1 Weekly Grocery Expenses The weekly grocery expenses for households in a certain region follow the the distribution given in Figure 1. According to a national consumer survey, the average grocery expense for this region is 107 with a standard deviation of \(38\). A random sample of 30 households is selected from this population.
What is the sampling distribution1 of \(\bar X\)?
- \(\bar X \sim N(0,1)\)
- \(\bar X \sim N(107,38)\)
- \(\bar X \sim N(107,38/30)\)
- \(\bar X \sim N(107,38/\sqrt{30})\)
- None of the above

✏️ Household Groceries
Exercise 2 Weekly Grocery Expenses The weekly grocery expenses for households in a certain region follow the the distribution given in Figure 1. According to a national consumer survey, the average grocery expense for this region is 107 with a standard deviation of \(38\). A random sample of 30 households is selected from this population.

What is the probability that the average weekly grocery expense for a randomly selected sample of 30 households exceeds $120?
Rolling a die

We first need to identify the distribution of \(X_i\)
Empirical Result

n = 1

n = 10

n = 30

Difference Sample Sizes

Comments
The sampling distribution gets “pointier” as the sample size increases
Hence as \(n\) increases the SE decreases
Hence as \(n\) decrease the SE increases